MLS® Sales Up 9%; MLS® Dollar Volume Rises 13%
WINNIPEG – Back to back months of the second and third best months ever on record with 1,638 transactions in June and 1,629 in May makes 2016 the most active year for the first six months and second quarter. Only May 2007 is higher than this June at 1,652 sales. The next busiest second quarter on record was in 2008 when again there were back to back outstanding monthly results with May and June each recording 1,564 sales.
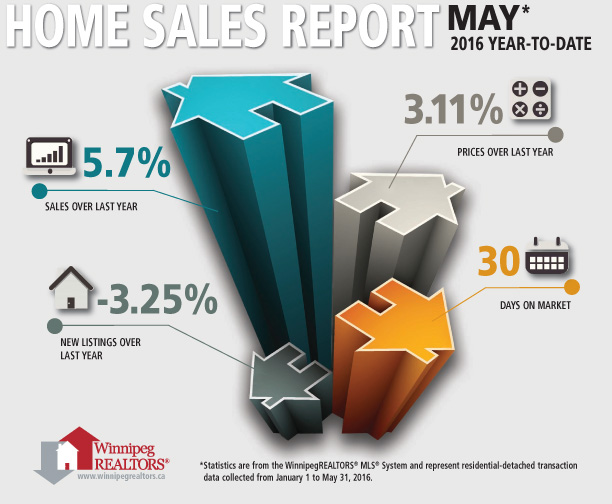
Sales were up 9% in June over the same month last year and the identical percentage increase for the first six months in comparison to the same period in 2015. It is the first time WinnipegREALTORS® has surpassed 7,000 MLS® sales in six months.
Single family homes led the way to this impressive June result with 1,252 sales or 76% of total MLS® sales. Condominiums did not perform as well in comparison to the previous two years but still very respectable at 187 sales or over 11% of total MLS® sales.
Eager buyers vying for coveted single family home listings translated to more above list price offers this June in comparison to last month and June 2015. Over one in four sold for above list price while last June 17% sold for above list price. As for condominiums only 5% sold for above list price in June. However 22% of condos achieved list price.
MLS® dollar volume of $472.3 million is up 13% over June 2015. It is the highest monthly dollar volume on record. Year-to-date dollar volume of close to $2 billion has risen 11% over the first half of 2015.
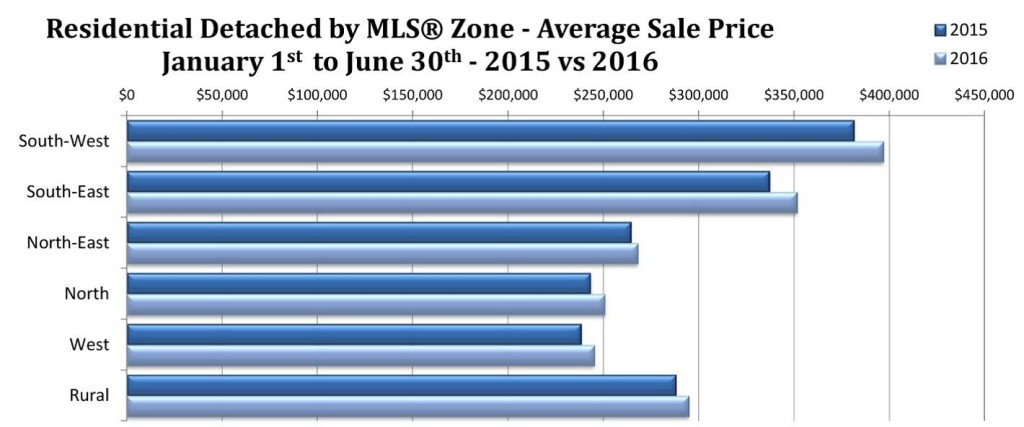
Price growth this year is more in line with the forecast for single family homes. A healthy supply of listings for the most part is keeping price increases in check. The chart below illustrates subdued price appreciation for all quadrants of Winnipeg and a similar pattern in the outlying rural municipalities when comparing the first half of 2016 to the same period in 2015.
Condo prices were not expected to see any discernible difference in 2016 if not facing some downward pressure owing to the abundance of MLS® listings and new condo supply on the market. They have decreased very modestly at this stage.
The average year-to-date price for single family homes and condominiums is $306,311 and $232,507 respectively.
Of course depending on the property type you have, its location, the number of competing similar property types with their own strengths and weaknesses, you need to be talking to an expert – a REALTOR® – who can advise you on what you need to do to maximise your chances of achieving the best price possible. For buyers a REALTOR® will be indispensable in imparting critical market intelligence on what prices they can expect to see in the current market for the property type they are interested in purchasing.
It pays to know the average price of homes for sale in your neighbourhood, as well as that of homes that have sold, including both over-list and under-list sales. We track all Winnipeg neighbourhoods daily, which allows us to more accurately set list prices on the homes we sell, while also making intelligent offers. If you would like a Free Home Value Appraisal in Crescentwood, River Heights, Tuxedo, Fort Garry, Fort Richmond, Linden Ridge, Linden Woods, Fort Whyte, Whyte Ridge, St. Norbert, Bridgewater Forest, Assiniboine Landing, Headingley, St. Boniface, Norwood, St. Vital, River Park South, Windsor Park, Southdale, Island lakes, Royalwood, Sage Creek, East Kildonan, Valley Gardens, North Kildonan, Eaglemere, Transcona, Birds HIll, East st. Paul, Pritchard Farm, West Kildonan, Riverbend, River Grove, Garden City, Maples, Polo Park, Deer Lodge, St. James, Silver Heights, Crestview, The Oakes, West St. Paul please Contact Us or Call (204) 792-6453. We track the market closely and you can too with Winnipeg Market Tracker.
Single family homes in particular are enjoying an exceptionally strong year, especially the last two months. Within some Winnipeg neighbourhoods there are not enough listings to meet existing demand. Fort Garry, Norwood, Windsor Park, Whyte Ridge, Crescentwood, Linden Woods, East Kildonan and Crestview are areas where we are seeing more sales in a month than the number of listings remaining on the market at the beginning of the next month.
Condominiums on the other hand are not enjoying near the same extent of sales to active listings conversions. This in part explains why there is less above list price sales than single family homes.
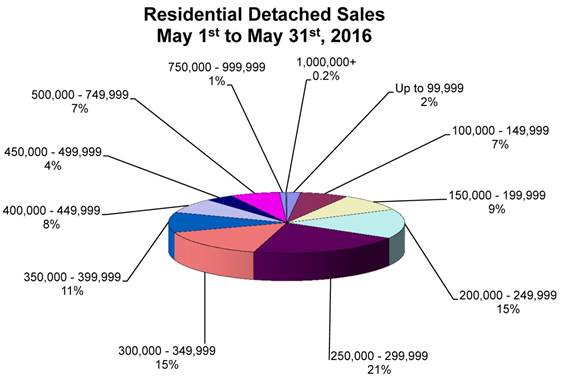
The most active price range in June for residential-detached sales was $250,000-$299,999 (22% of sales), followed by the $300,000-$349,999 range (17%) and the $200,000-$249,999 (15%).
Average days on market for residential-detached sales was 26 days, 3 days quicker than June 2015. The highest priced residential-detached sale was $1,450,000 and the least expensive sale was $35,000.
The most active price range for condominiums was $200,000-$249,999 (26% of sales), followed by the $150,000-$199,999 range (23%) and the $250,000-$299,999 range (17%). Average days on market for condo sales was 43 days, a turnaround that is 6 days quicker than June 2015. The highest priced condo sold for $645,000 while the lowest was $66,000.
Track the Winnipeg Real Estate Market!! Free Automated Email Service allows you to track the MLS market in real time. Follow the values in any neighborhood in Winnipeg. Find out what your neighbor’s house down the street sold for. Follow Winnipeg MLS listings in real time. Visit Winnipeg Market Tracker!
This information is courtesy of: The Michael Leclerc Home Selling TeamRoyal LePage Top Producers
Winnipeg MB
Phone: (204) 792-6453

