WINNIPEG – After a solid first quarter of MLS® sales activity, April sales were more subdued. Unit sales of 1,300 were down 5% from a record April in 2016 but still up 2% over the 10-year average for this month.
MLS® dollar volume decreased 1% in April however for the first four months is up 2% to $1.08 billion. New MLS® listings in April fell 5% while the inventory or active listings at the end of April is down 7%.
The percentage of new listings being converted to sales is in line with April 2016 when the equivalent of over 53% of the 2,439 listings entered on the MLS® in April were sold.
The drop off in sales activity compared to April 2016 was most noticeable in the first-time buyer market segment. WinnipegREALTORS® has identified a concern regarding the new stress test on insured mortgages and its impact on buyer qualification.
For residential-detached properties under $300,000 there was a 15% decrease in sales activity in comparison to last April. On the other hand upper price ranges in residential-detached outperformed April 2016.
There was also a decline in condominium sales in the price ranges from $150,000 to $249,999.
Another new development this year which helped propel higher end sales was the City of Winnipeg’s impact fee which came into effect on May 1, 2017. There have already been 15 sales of homes valued over $1 million and six of those are new or to be built homes in the Waverley West MLS® area. It is clear buyers are advancing their plans to commit earlier this year to avoid paying the impact fee ($500 for every 100 square feet).
It is also apparent from examining April sales activity that vacant lots in rural municipalities benefited from the onset of higher fees in Winnipeg as there was a jump of 27% in vacant lot sales from April 2016. The vast majority of those are located outside Winnipeg.
It pays to know the average price of homes for sale in your neighbourhood, as well as that of homes that have sold, including both over-list and under-list sales. We track all Winnipeg neighbourhoods daily, which allows us to more accurately set list prices on the homes we sell, while also making intelligent offers. If you would like a Free Home Value Appraisal in Crescentwood, River Heights, Tuxedo, Fort Garry, Fort Richmond, Linden Ridge, Linden Woods, Fort Whyte, Whyte Ridge, St. Norbert, Bridgewater Forest, Assiniboine Landing, Headingley, St. Boniface, Norwood, St. Vital, River Park South, Windsor Park, Southdale, Island lakes, Royalwood, Sage Creek, East Kildonan, Valley Gardens, North Kildonan, Eaglemere, Transcona, Birds HIll, East st. Paul, Pritchard Farm, West Kildonan, Riverbend, River Grove, Garden City, Maples, Polo Park, Deer Lodge, St. James, Silver Heights, Crestview, The Oakes, West St. Paul please Contact Us or Call (204) 792-6453. We track the market closely and you can too with Winnipeg Market Tracker.
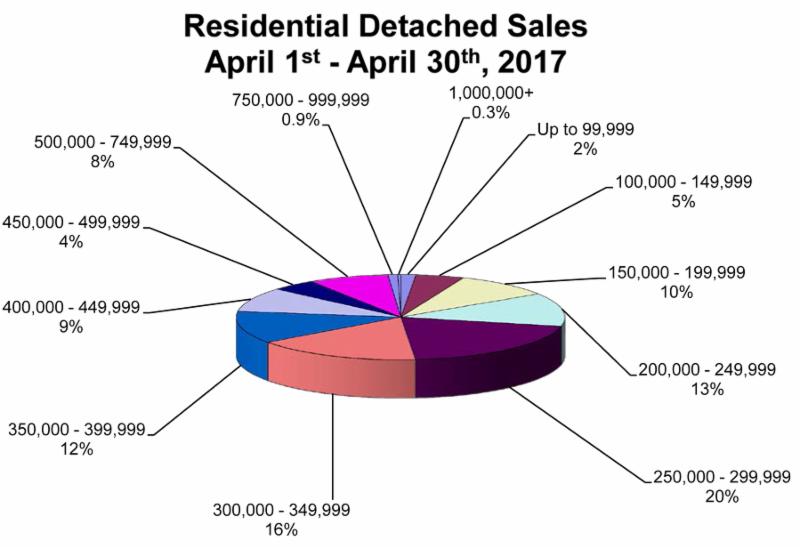
In terms of residential-detached sales activity while the most active price range remained from $250,000 to $299,999 at 20% the next busiest from $300,000 to $349,999 was not far off at 16%.
The average days to sell a home in April was 25 days, one day quicker than the record-setting April 2016. The sales- to -list price ratio in April was 99.19%, an improvement from the 98.59% in April 2016.
Condominium sales continue to be most active in the $150,000 to $199,999 price range which represented 30% of total sales. Next busiest at 16% was the $200,000 to $249,999 price range. Average days to sell a condo in April was 40 days, one day quicker than April 2016.
Track the Winnipeg Real Estate Market!! Free Automated Email Service allows you to track the MLS market in real time. Follow the values in any neighborhood in Winnipeg. Find out what your neighbor’s house down the street sold for. Follow Winnipeg MLS listings in real time. Visit Winnipeg Market Tracker!
This information is courtesy of: The Michael Leclerc Home Selling TeamRoyal LePage Top Producers
Winnipeg MB
Phone: (204) 792-6453


