Sales in March resulted in a slower first quarter especially in comparison to the two best years on record in 2016 and 2017. Sales of 2,228 are down over 8% from the first 3 months in 2017, and 4% over the 10-year average. March sales of 974 decreased 12% from March 2017, and 5% over the 10-year average. March new listings at just under 2,100 were down to a lesser extent at 5%.
Current inventory of MLS® listings going into the second quarter is almost identical to last year. It sits around 3,900 listings with a modest percentage gain of residential-detached listings available while condominium listings slipped slightly.
It is fair to say while market fundamentals are firmly in place in the local market, new mortgage rules combined with higher mortgage rates in the last year have made it more difficult for some buyers to purchase their desired property. This not only applies to first-time buyers, but to existing home owners who instead of listing their property have decided to stay put as the tougher qualifying environment keeps them from moving ahead with a new purchase.

As in other real estate markets across the country, strong year-end sales within the Winnipeg Metropolitan Region in November and December in advance of the January 1, 2018 new stress test on uninsured mortgages would have had a pull-forward effect on sales happening this first quarter.
The second quarter is by far the busiest quarter of the year. We will be seeing if April brings back some of the market that was lost in the first quarter.
Further analysis of both residential-detached and condominium properties provide a few observations.
While condominiums saw sales drop 14% in the first quarter, they are only 1% below the 10-year average. The average sales price of $240,740 was less than 2% below the more active first quarter of 2017.
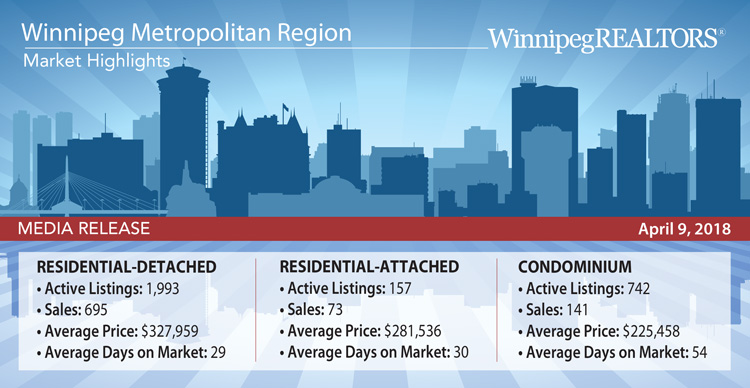
Residential-detached, the most expensive property type class and one most vulnerable to recent policy-related moves to slow down the housing market, experienced an 11% decline over the 2017 first quarter, and a 7% drop off in same period sales over the 10-year average. The average sales price was higher however at $327,959 compared to $319,549, up nearly 3%, and the average days to sell was 29 versus 27 in 2017.
It is also worth noting the ratio of total sales price, to total list price, edged up to 99% in the month of March. This high percentage ratio can be attributed in part to a number of MLS® areas seeing whatever listings they had available sell quickly.

Track the Winnipeg Real Estate Market!! Free Automated Email Service allows you to track the MLS market in real time. Follow the values in any neighborhood in Winnipeg. Find out what your neighbor’s house down the street sold for. Follow Winnipeg MLS listings in real time. Visit Winnipeg Market Tracker!
This information is courtesy of: The Michael Leclerc Home Selling TeamRoyal LePage Top Producers
Winnipeg MB
Phone: (204) 792-6453

Leave a Reply