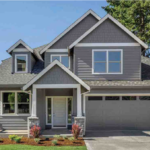
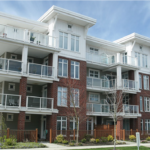
Detached Attached Condominiums
| Active Listings: | 244 | 1,612 | 443 |
| Sales: | 72 | 698 | 149 |
| Average Price: | $328,449 | $386,833 | $245,165 |
| Average sq ft: | 1,330 | 1,249 | 1,004 |
WINNIPEG, April 12, 2023 – Along with the number of active listings on the market, MLS® sales in March continued to grow from last month marking a sustained transition back to the type of market seen before the pandemic began. The number of active listings is up over last year but still has room for growth before meeting the levels seen before the pandemic began.
Meanwhile, MLS® sales for March 2023 were below the record March sales totals in 2021 and 2022 and slightly above the levels seen before the pandemic.Of the 3,368 MLS® active listings across our market region in March, 1,565 were in Winnipeg while, 1,803 were in the rural areas outside Winnipeg and of the 1,014 MLS® sales across our market region, 664 were in Winnipeg with 350 in the rural areas outside Winnipeg.
                                     All MLS®
                      March 2023     vs. 2022       vs. 5-Year Avg.
Active Listings       3,368        77.54% (1,897)    1.40% (3,321)
Total Sales           1,014       -29.19% (1,432)   -22.08% (1,301)
                                Residential-Detached
                      March 2023      vs. 2022      vs. 5-Year Avg.

Active Listings       1,612        107.46% (777)     1.18% (1,593)
Total Sales           698         -28.04% (970)     -21.64% (891)
Average Price         $386,833    -12.07% ($439,914) 2.49% ($377,452)
Of the 1,612 residential detached MLS® active listings across our market region, 773 were in Winnipeg, while 839 were in the rural areas outside Winnipeg. Of the 698 residential detached MLS® sales, 471 were in Winnipeg while the remaining
227 occurred in the rural areas outside Winnipeg.
                                 Residential-Attached
                     March 2023     vs. 2022      vs. 5-Year Avg.

Active Listings      244          132.38%(105)      40.23%(174)
Total Sales          72          -31.43% (105)     -29.99%(101)
Average Price        $328,449    - 5.91% ($349,074) 2.49% ($377,452)
                                  Condominiums
                     March 2023     vs. 2022      vs. 5-Year Avg.
Active Listings      443          35.06% (328)     -24.53% (587)
Total Sales          149         -34.36% (227)     -20.15% (187)
Average Price        $245,165    -5.97% ($260,722) -0.55% ($246,516)
Of the 443 active listings for condominiums across our market region, 315 were in Winnipeg and 128 were in the rural area outside Winnipeg. Of the 149 total MLS® condominium sales in March, 122 were in Winnipeg and the remaining 27 occurred in the rural area outside Winnipeg.
Track the Winnipeg Real Estate Market!! Free Automated Email Service allows you to track the MLS market in real time. Follow the values in any neighborhood in Winnipeg. Find out what your neighbor’s house down the street sold for. Follow Winnipeg MLS listings in real time. Visit Winnipeg Market Tracker!
This information is courtesy of
Michael Leclerc Royal LePage
Top Producers Winnipeg MB
Phone (204) 792-6453
