Courtesy of WinnipegREALTORS®
WINNIPEG – True to form February MLS® market activity marked another solid result in sales which were 4% above the 10-year average for this winter month. So being down 6% from February 2016 which is the only February to reach and eclipse 800 in sales is no reason to be disappointed.
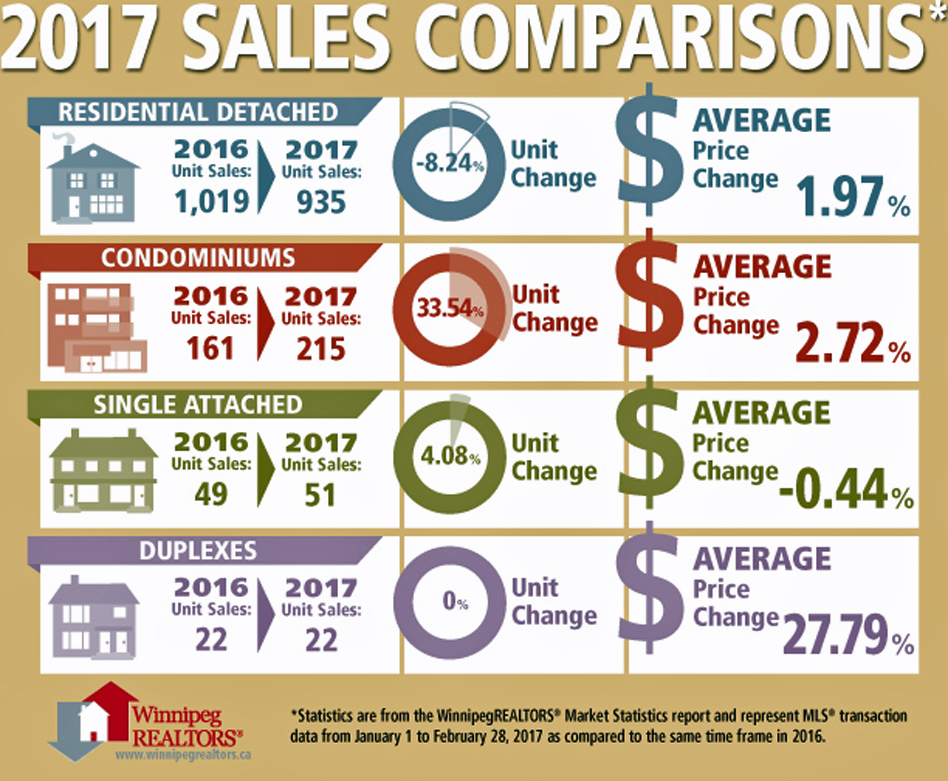
One clear pattern emerging this year has been the fast start to condominium sales. Year-to-date sales are up 33% and dollar volume has jumped 37%. One thing is for sure. There is no lack of listings to enable this pattern to continue. With the exception of 2016 where the condominium inventory was nearly 12% higher than the current 665 condominium listings on the market now, they remain elevated over previous years. Only 2015 is close since it was the first year when a real spike in condominium supply took off.
On the other hand residential-detached or single family properties are not keeping up with last year’s record-setting pace. Listings entered on MLS® for the first two months have decreased 6% while sales are down 8%.
One price range which did unusually well in February was for home sales over $1 million. You often may not have one sale in this month as was the case in 2016 or just one in February 2015. This year there were 7 and this significant difference is the first clear indication of the City of Winnipeg’s new impact fee on new residential property. Buyers intending to build their luxury homes in Winnipeg are advancing their plans to avoid paying Winnipeg’s impact fee which comes into effect May 1, 2017.
February MLS® unit sales of 766 were down 6% in comparison to February 2016 while dollar volume of $217.4 million decreased 2% from the same month last year. New listings coming on the market in February also fell 9% from February 2016.

Regardless of some of the new wrinkles in the 2017 real estate market one overriding housing demand driver well intact is immigration and the manifestation of it in population increases. In February some of the Statistics Canada 2016 census data was released which showed Manitoba is growing at a faster rate than the national average. While Winnipeg’s growth rate from 2011 to 2016 was 6.6%, higher but less than a percentage point above Manitoba’s at 5.5%, what really stood out is to what extent some of the rural municipalities within the capital region are growing. Steinbach’s has increased 17%, Niverville (26.6%), Ste. Anne (30%), Blumenort (19.3%) and Ile des Chenes (25.1%).
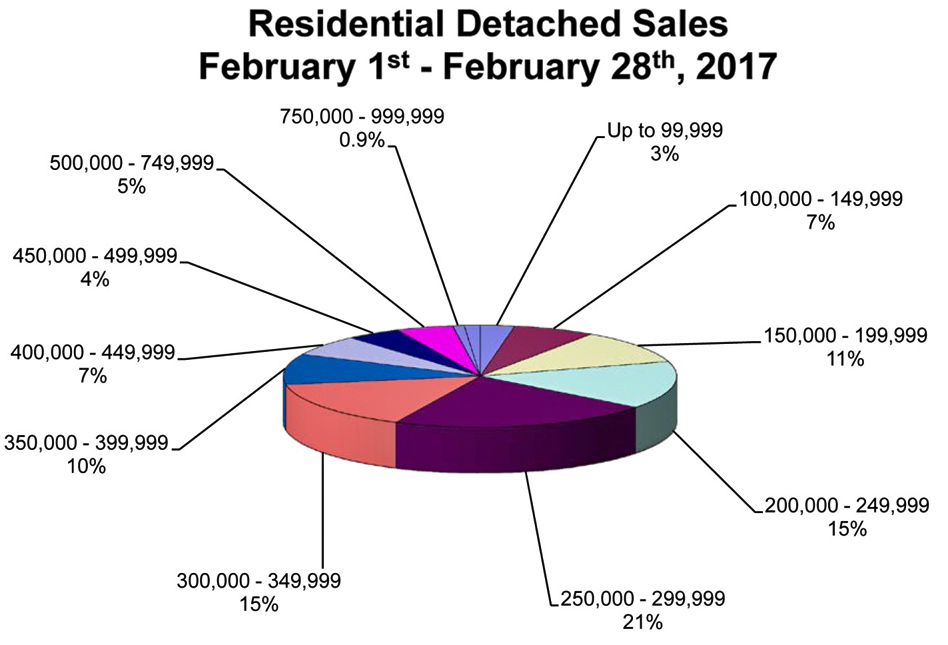
The most active residential-detached price range was from $250,000-$299,999 at 21%. Another 30% of residential-detached sales came from the next higher and lower price ranges with both tallying 15% of total sales. The average days to sell a residential-detached property was 34 days, 3 days faster than February 2016.
The most active condo price range was the $150,000-$199,999 at 36% of total sales. The average days to sell a condominium was 45 days, 3 days quicker than February 2016.
All markets are not only local like WinnipegREALTORS® market region but vary within as evident from differences in population growth rates. Whether buying or selling you should be calling a REALTOR® because they know the variations within a local market and how the different property types behave throughout the capital region.