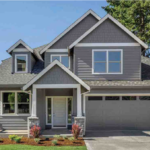
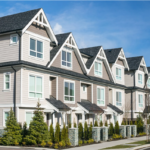
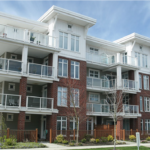
Detached Attached Condominiums
| Active Listings: | 1761 | 252 | 484 |
| Sales: | 763 | 79 | 171 |
| Average Price: | $409,286 | $326,995 | $258,571 |
| Average sq ft: | 1,366 | 1,272 | 1,035 |
WINNIPEG, May 10, 2023 – In a trend that has continued since the start of 2023, the number of MLS® sales has continued to rise but not to the same levels seen last April or over the 5-year average. MLS® sales were down when compared to last year and the 5-year average while the number of active MLS® listings continued to rise, with increases over last month,last year and the 5-year average.
Of the 1,103 MLS® sales across our market region, 729 were in Winnipeg with 374 in the rural areas outside Winnipeg and
of the 3,584 MLS® active listings in April, 1,600 were in Winnipeg while 1,984 were in the rural areas outside Winnipeg.

MLS® sales in April were 90% higher than January, 68% higher than February and 9% higher than March. Active MLS®
listings in April were 28% higher than January, 18% higher than February and 6% higher than March.
                                Residential-Detached
                      April 2023      vs. 2022      vs. 5-Year Avg.

Active Listings       3,368        77.54% (1,897)     1.18% (1,593)
Total Sales           1014        -29.19% (1,432)    -22.08% (1,301)
Average Price         $386,833    -12.07% ($439,914)  2.49% ($377,452)


Of the 763 residential detached MLS® sales across our market region, 508 were in Winnipeg while the remaining 255
occurred in the rural areas outside Winnipeg. Of the 1,761 residential detached MLS® active listings, 822 were in
Winnipeg while 939 were in the rural areas outside Winnipeg.
Residential detached homes made up 69% of all MLS® home sales in April. Southwest Winnipeg had the most sales within
the city, representing 30% of all Winnipeg residential detached home sales. The rural area outside Winnipeg represented
30% of all MLS® residential detached home sales.
                                 Residential-Attached
                     April 2023     vs. 2022      vs. 5-Year Avg.

Active Listings      252           107%(122)        39%(182)
Total Sales          79            -28%(105)       -11%(89)
Average Price        $326,995      -12%($370,604)   6%($308,526)

Of the 79 total MLS® residential attached home sales across our market region in April, 53 were in Winnipeg and the
remaining 26 occurred in the rural area outside Winnipeg. Of the 252 active listings for residential attached homes, 152
were in Winnipeg and 100 were in the rural area outside Winnipeg.

                                  Condominiums
                     April 2023     vs. 2022      vs. 5-Year Avg.
Active Listings      484           42%(341)        -19%(598)
Total Sales          171          -24%(224)        -5%(180)
Average Price        $258,571     -1%($261,802)     3%($251,241)

Of the 171 total MLS® condominium sales across our market region in April, 142 were in Winnipeg and the remaining 29
occurred in the rural area outside Winnipeg
Track the Winnipeg Real Estate Market!! Free Automated Email Service allows you to track the MLS market in real time. Follow the values in any neighborhood in Winnipeg. Find out what your neighbor’s house down the street sold for. Follow Winnipeg MLS listings in real time. Visit Winnipeg Market Tracker!
This information is courtesy of
Michael Leclerc Royal LePage
Top Producers Winnipeg MB
Phone (204) 792-6453


Leave a Reply